手把手帶你了解Python數據分析--matplotlib
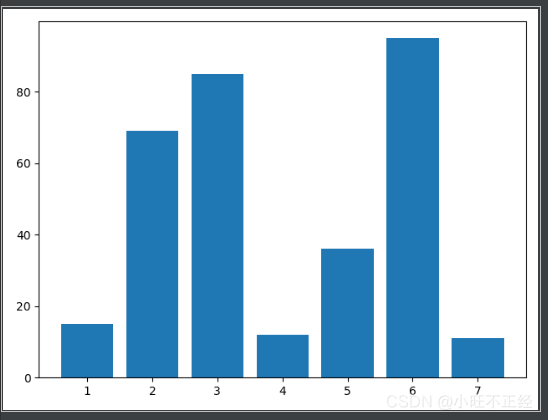
bar()函數繪制柱形圖
import matplotlib.pyplot as plx = [1,2,3,4,5,6,7]y = [15,69,85,12,36,95,11]pl.bar(x,y)pl.show()
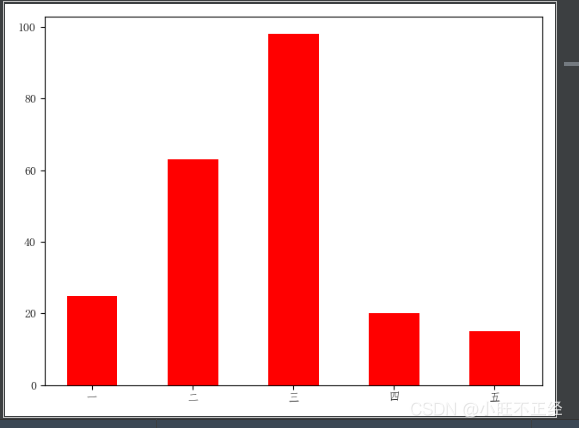
bar()函數的參數width和color設置每根柱子的寬度和顏色有中文時要添加pl.rcParams[’font.sans-serif’] = [’FangSong’]有負號時要添加pl.rcParams[’axes.unicode_minus’] = False
import matplotlib.pyplot as plpl.rcParams[’font.sans-serif’] = [’FangSong’]x = [’一’,’二’,’三’,’四’,’五’]y = [25,63,98,20,15]pl.bar(x,y,width=0.5,color=’red’)pl.show()
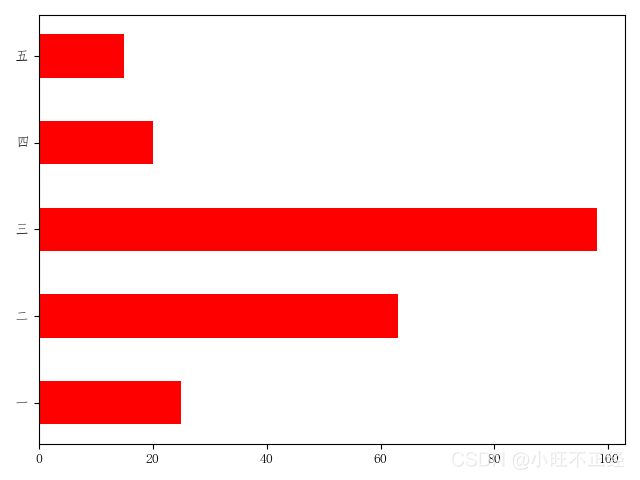
barh()函數可繪制條形圖
參數height設置條形的高度
import matplotlib.pyplot as plpl.rcParams[’font.sans-serif’] = [’FangSong’]x = [’一’,’二’,’三’,’四’,’五’]y = [25,63,98,20,15]pl.barh(x,y,height=0.5,color=’red’)pl.show()
plot()函數可繪制折線圖
import matplotlib.pyplot as plpl.rcParams[’font.sans-serif’] = [’FangSong’]x = [’一’,’二’,’三’,’四’,’五’]y = [25,63,98,20,15]pl.plot(x,y,linewidth=2,linestyle=’-’,color=’red’,marker=’*’,markersize=10)pl.show()
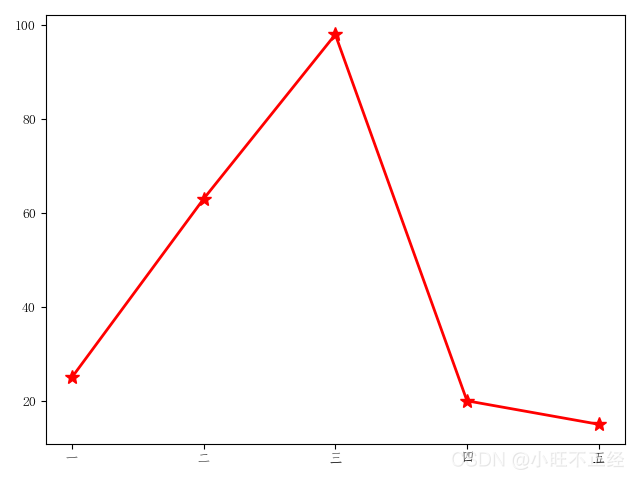
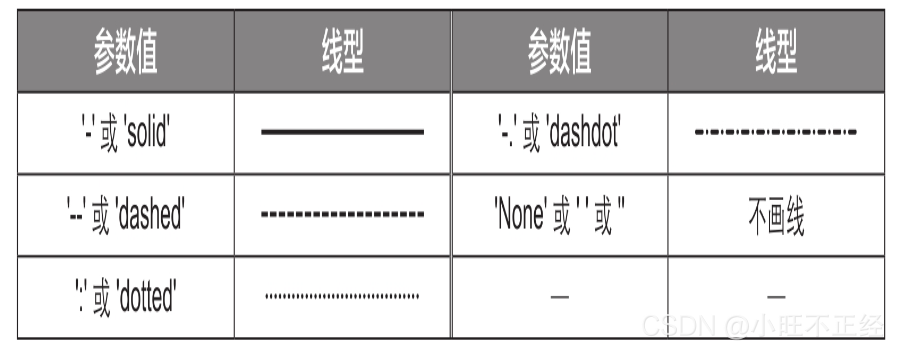
參數linewidth用于設置折線的粗細(單位為“點”)參數linestyle用于設置折線的線型
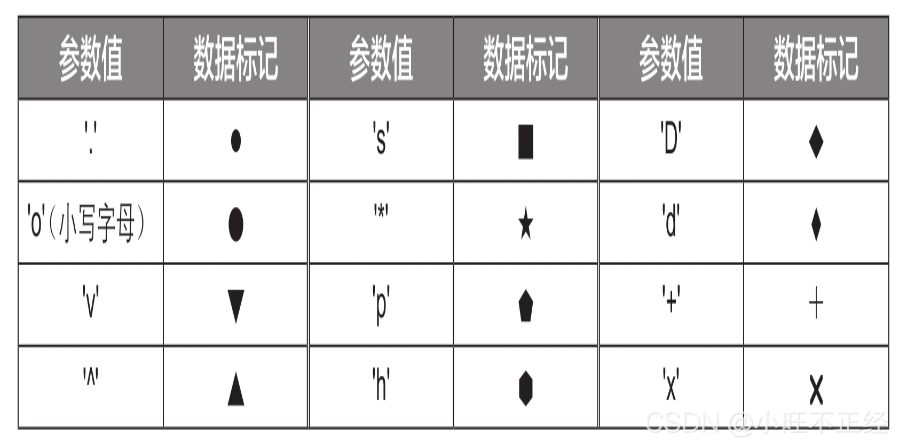
marker= ’*’表示設置數據標記的樣式為五角星markersize=10表示設置數據標記的大小為10點
pie()函數可繪制餅圖
import matplotlib.pyplot as plpl.rcParams[’font.sans-serif’] = [’FangSong’]x = [’一’,’二’,’三’,’四’,’五’]y = [25,63,98,20,15]pl.pie(y,labels=x,labeldistance=1,autopct=’%.2f%%’,pctdistance=1.2)pl.show()
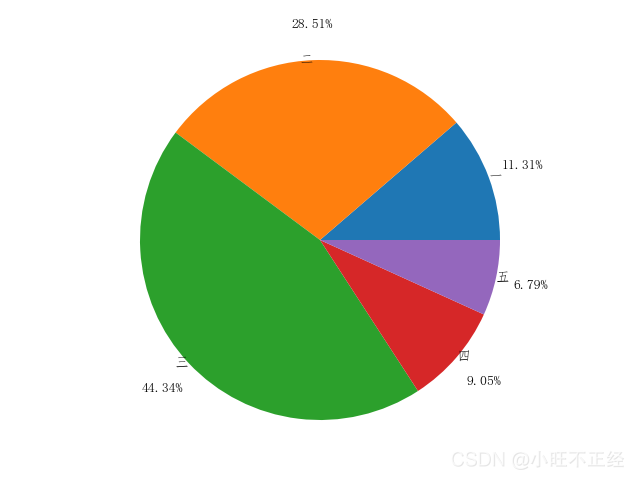
參數labels用于設置每一個餅圖塊的標簽參數labeldistance用于設置每一個餅圖塊的標簽與中心的距離參數autopct用于設置百分比數值的格式參數pctdistance用于設置百分比數值與中心的距離
分離餅圖塊import matplotlib.pyplot as plpl.rcParams[’font.sans-serif’] = [’FangSong’]x = [’一’,’二’,’三’,’四’,’五’]y = [25,63,98,20,15]pl.pie(y,labels=x,labeldistance=1,autopct=’%.2f%%’,pctdistance=1.2,explode=[0,0,0,0,0.3],startangle=90,counterclock=False)pl.show()
參數explode用于設置每一個餅圖塊與圓心的距離,其值通常是一個列表,列表的元素個數與餅圖塊的數量相同。這里設置為[0, 0, 0, 0, 0, 0.3],第5個元素為0.3,其他元素均為0,表示將第5個餅圖塊分離。參數startangle用于設置第1個餅圖塊的初始角度參數counterclock用于設置各個餅圖塊是逆時針排列還是順時針排列,為False時表示順時針排列,為True時表示逆時針排列。

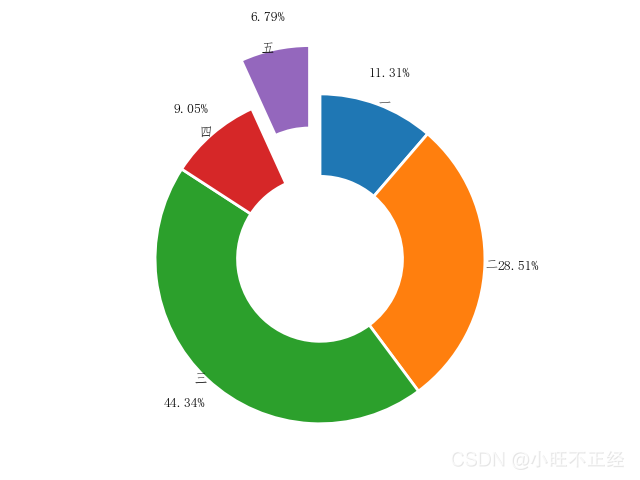
import matplotlib.pyplot as plpl.rcParams[’font.sans-serif’] = [’FangSong’]x = [’一’,’二’,’三’,’四’,’五’]y = [25,63,98,20,15]pl.pie(y,labels=x,labeldistance=1,autopct=’%.2f%%’,pctdistance=1.2,explode=[0,0,0,0,0.3],startangle=90,counterclock=False, wedgeprops={’width’:0.5,’linewidth’:2,’edgecolor’:’white’})pl.show()
wedgeprops={‘width’: 0.5, ‘linewidth’:2, ‘edgecolor’: ‘white’}表示設置餅圖塊的環寬(圓環的外圓半徑減去內圓半徑)占外圓半徑的比例為0.5邊框粗細為2邊框顏色為白色。將餅圖塊的環寬占比設置為小于1的數(這里為0.3)就能繪制出圓環圖
本篇文章就到這里了,希望能給你帶來幫助,也希望您能夠多多關注好吧啦網的更多內容!
相關文章:
 網公網安備
網公網安備