基于Python繪制子圖及子圖刻度的變換等的問(wèn)題
先看看效果

accuracy_alexnet_clef = [78.05, 78.43, 78.65, 78.61, 78.69]accuracy_resnet_clef = [84.56, 84.84, 85.07, 85.01, 85.13]accuracy_alexnet_office10 = [87.30, 87.57, 87.78, 87.72, 87.50]accuracy_resnet_office10 = [96.31, 96.35, 96.62, 96.43, 96.15]orders = [’2’, ’3’, ’5’, ’10’, ’20’]names = [’alexnet’, ’resnet’]# 創(chuàng)建兩幅子圖f, ax = plt.subplots(2,1,figsize=(6, 8))# 第一根柱子偏移坐標(biāo)x = [i for i in range(len(orders))]# 第二根柱子偏移坐標(biāo)x1 = [i + 0.35 for i in range(len(orders))]# 兩幅子圖之間的間距plt.subplots_adjust(wspace =0, hspace =0.4)# 選擇第一幅圖figure_1 = ax[0]# 設(shè)置x軸偏移和標(biāo)簽figure_1.set_xticks([i+0.15 for i in x])figure_1.set_xticklabels(orders)# 設(shè)置y軸的范圍figure_1.set_ylim(bottom=77,top=86)# 繪制柱狀圖,x表示x軸內(nèi)容,accuracy_alexnet_clef表示y軸的內(nèi)容,alpha表示透明度,width表示柱子寬度# label表示圖列figure_1.bar(x, accuracy_alexnet_clef, alpha=0.7, width = 0.35, facecolor = ’#4c72b0’, label=’Alexnet’)figure_1.bar(x1, accuracy_resnet_clef, alpha=0.7, width = 0.35, facecolor = ’#dd8452’, label=’Resnet’)figure_1.set_ylabel(’Accuracy%’) # 設(shè)置y軸的標(biāo)簽figure_1.set_xlabel(’Order’) # 設(shè)置x軸的名稱figure_1.set_title(’Alexnet’) # 設(shè)置圖一標(biāo)題名稱figure_1.legend() # 顯示圖一的圖例# 選擇第二幅圖figure_2 = ax[1]figure_1.set_xticks([i+0.15 for i in x])figure_1.set_xticklabels(orders)figure_2.set_ylim(bottom=77,top=100)figure_2.bar(x, accuracy_alexnet_office10,alpha=0.7,width = 0.35,facecolor = ’#c44e52’, label=’Alexnet’)figure_2.bar(x1, accuracy_resnet_office10,alpha=0.7,width = 0.35,facecolor = ’#5f9e6e’, label=’Alexnet’)# figure_2.bar(orders, accuracy_resnet_clef,alpha=0.7,width = 0.35,facecolor = ’#dd8452’)figure_2.set_ylabel(’Accuracy%’)figure_2.set_xlabel(’Order’)figure_2.set_title(’Resnet’)figure_2.legend()f.suptitle(’ImageCLEF_DA’) # 設(shè)置總標(biāo)題plt.show()
補(bǔ)充:python使用matplotlib在一個(gè)圖形中繪制多個(gè)子圖以及一個(gè)子圖中繪制多條動(dòng)態(tài)折線問(wèn)題
在講解繪制多個(gè)子圖之前先簡(jiǎn)單了解一下使用matplotlib繪制一個(gè)圖,導(dǎo)入繪圖所需庫(kù)matplotlib并創(chuàng)建一個(gè)等間隔的列表x,將[0,2*pi]等分為50等份,繪制函數(shù)sin(x)。當(dāng)沒(méi)有給定x軸數(shù)值時(shí),默認(rèn)以下標(biāo)作為x的值,如果x值確定,則繪圖時(shí)寫(xiě)為plt.plot(x,y) 。
如若想要繪制一個(gè)圖時(shí)寫(xiě)入標(biāo)簽,則寫(xiě)為plt.plot(x,y,label='figure1')。
from numpy import *import matplotlib.pyplot as plt x = linspace(0, 2 * pi, 50)plt.plot(sin(x))plt.xlabel(’x-label’)plt.ylabel(’y-label’, fontsize=’large’)plt.title(’title’)

以下先將整體代碼插入,再分布講解:
import numpy as npimport matplotlib.pyplot as plt from matplotlib.ticker import MultipleLocator, FormatStrFormatter def minmax_value(list1): minvalue=min(list1) maxvalue=max(list1) return minvalue,maxvalueplt.figure(figsize=(16,14),dpi=98)xmajorLocator = MultipleLocator(1) #將x主刻度標(biāo)簽設(shè)置為1的倍數(shù)plt.rcParams[’font.sans-serif’]=[’SimHei’] plt.rcParams[’axes.unicode_minus’] = Falsep1 = plt.subplot(121)p2 = plt.subplot(122)#圖中展示點(diǎn)的數(shù)量pointcount=5x=[i for i in range(20)]print(x)y1=[i**2 for i in range(20)]y2=[i*4 for i in range(20)]y3=[i*3+2 for i in range(20)]y4=[i*4 for i in range(20)]for i in range(len(x)-1): if i<pointcount:minx,maxx=minmax_value(x[:pointcount])minx,maxx=minmax_value(x[:pointcount])minyA,maxyA=minmax_value(y1[:pointcount])minyB,maxyB=minmax_value(y2[:pointcount])maxy1=max(maxyA,maxyB)miny1=min(minyA,minyB)p1.axis([minx,maxx,miny1,maxy1])p1.grid(True)A,=p1.plot(x[:pointcount],y1[:pointcount],'g-')B,=p1.plot(x[:pointcount],y2[:pointcount],'b-')#設(shè)置主刻度標(biāo)簽的位置,標(biāo)簽文本的格式p1.xaxis.set_major_locator(xmajorLocator)legend=p1.legend(handles=[A,B],labels=['圖1','圖2']) minx,maxx=minmax_value(x[:pointcount])minx,maxx=minmax_value(x[:pointcount])minyA,maxyA=minmax_value(y3[:pointcount])minyB,maxyB=minmax_value(y4[:pointcount])maxy1=max(maxyA,maxyB)miny1=min(minyA,minyB)p2.axis([minx,maxx,miny1,maxy1])p2.grid(True)A,=p2.plot(x[:pointcount],y3[:pointcount],'r-')B,=p2.plot(x[:pointcount],y4[:pointcount],'y-')#設(shè)置主刻度標(biāo)簽的位置,標(biāo)簽文本的格式p2.xaxis.set_major_locator(xmajorLocator)legend=p2.legend(handles=[A,B],labels=['圖3','圖4']) elif i>=pointcount:minx,maxx=minmax_value(x[i-pointcount:i])minx,maxx=minmax_value(x[i-pointcount:i])minyA,maxyA=minmax_value(y1[i-pointcount:i])minyB,maxyB=minmax_value(y2[i-pointcount:i])maxy1=max(maxyA,maxyB)miny1=min(minyA,minyB)p1.axis([minx,maxx,miny1,maxy1])p1.grid(True)A,=p1.plot(x[i-pointcount:i],y1[i-pointcount:i],'g-')B,=p1.plot(x[i-pointcount:i],y2[i-pointcount:i],'b-')#設(shè)置主刻度標(biāo)簽的位置,標(biāo)簽文本的格式p1.xaxis.set_major_locator(xmajorLocator)legend=p1.legend(handles=[A,B],labels=['圖1','圖2'])minx,maxx=minmax_value(x[i-pointcount:i])minx,maxx=minmax_value(x[i-pointcount:i])minyA,maxyA=minmax_value(y3[i-pointcount:i])minyB,maxyB=minmax_value(y4[i-pointcount:i])maxy1=max(maxyA,maxyB)miny1=min(minyA,minyB)p2.axis([minx,maxx,miny1,maxy1])p2.grid(True)A,=p2.plot(x[i-pointcount:i],y3[i-pointcount:i],'r-')B,=p2.plot(x[i-pointcount:i],y4[i-pointcount:i],'y-')#設(shè)置主刻度標(biāo)簽的位置,標(biāo)簽文本的格式p2.xaxis.set_major_locator(xmajorLocator)legend=p2.legend(handles=[A,B],labels=['圖3','圖4']) p1.set_xlabel('橫軸屬性名一',fontsize=14) p1.set_ylabel('縱軸屬性名一',fontsize=14) p1.set_title('主題一',fontsize=18)p2.set_xlabel('橫軸屬性名二',fontsize=14) p2.set_ylabel('縱軸屬性名二',fontsize=14) p2.set_title('主題二',fontsize=18) plt.pause(0.3) plt.tight_layout(pad=4, w_pad=4.0, h_pad=3.0)
運(yùn)行結(jié)果為:

1、導(dǎo)入庫(kù)
import numpy as npimport matplotlib.pyplot as plt from matplotlib.ticker import MultipleLocator, FormatStrFormatter
2、由于繪圖過(guò)程中多次使用獲取最大最小值,將獲取最大最小值寫(xiě)入函數(shù),后面直接調(diào)用函數(shù)即可。
def minmax_value(list1): minvalue=min(list1) maxvalue=max(list1) return minvalue,maxvalue
3、
(1)創(chuàng)建自定義圖像,并設(shè)置figured的長(zhǎng)和寬以及dpi參數(shù)指定繪圖對(duì)象的分辨率;
(2)設(shè)置x軸刻度的間隔;
(3)對(duì)本次繪圖中的字體進(jìn)行設(shè)置;
(4)在matplotlib下,一個(gè)figure對(duì)象可以包含多個(gè)子圖(Axes),使用subplot()快速繪制。
plt.figure(figsize=(16,14),dpi=98)xmajorLocator = MultipleLocator(1)plt.rcParams[’font.sans-serif’]=[’SimHei’] plt.rcParams[’axes.unicode_minus’] = False p1 = plt.subplot(121)p2 = plt.subplot(122)
4、當(dāng)數(shù)據(jù)量過(guò)多時(shí),對(duì)數(shù)據(jù)一次性展示不能夠達(dá)到對(duì)數(shù)據(jù)內(nèi)部信息的解讀。本例采用一次展示其中一部分?jǐn)?shù)據(jù),并動(dòng)態(tài)的更新圖片,于此同時(shí),動(dòng)態(tài)更新橫縱坐標(biāo)軸的取值范圍。下面代碼首先設(shè)置了每次展示點(diǎn)的數(shù)量,并獲取了主題一中的所有數(shù)據(jù)值。根據(jù)x取值范圍和值域y獲取當(dāng)前繪圖過(guò)程中的橫縱坐標(biāo)取值范圍,最后根據(jù)x,y的值進(jìn)行繪圖。
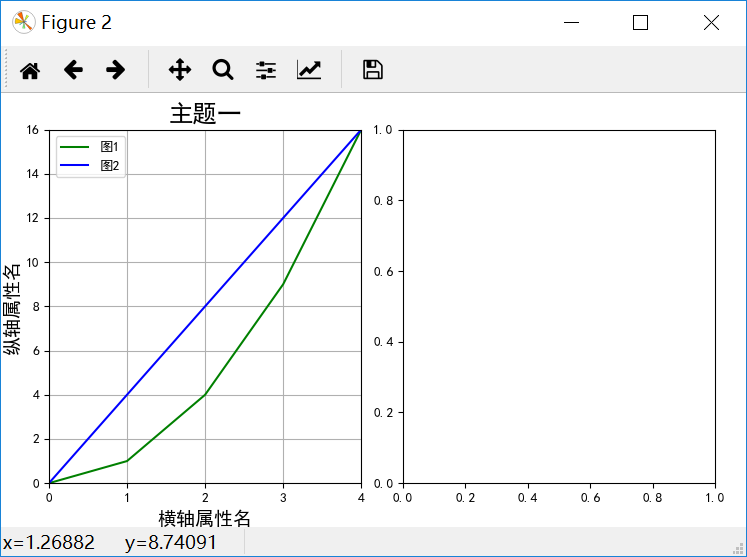
下面將先在一個(gè)子圖上顯示兩條靜態(tài)折現(xiàn)。當(dāng)使用動(dòng)態(tài)的折線圖時(shí),只需動(dòng)態(tài)更新數(shù)據(jù)和橫縱坐標(biāo)的取值范圍。總體代碼中已經(jīng)寫(xiě)出,下面不再贅述。
#圖中展示點(diǎn)的數(shù)量pointcount=5x=[i for i in range(20)]y1=[i**2 for i in range(20)]y2=[i*4 for i in range(20)]minx,maxx=minmax_value(x[:pointcount])minyA,maxyA=minmax_value(y1[:pointcount])minyB,maxyB=minmax_value(y2[:pointcount])maxy1=max(maxyA,maxyB)miny1=min(minyA,minyB)p1.axis([minx,maxx,miny1,maxy1])p1.grid(True)#繪圖過(guò)程中出現(xiàn)的網(wǎng)格設(shè)置A,=p1.plot(x[:pointcount],y1[:pointcount],'g-')B,=p1.plot(x[:pointcount],y2[:pointcount],'b-')#設(shè)置主刻度標(biāo)簽的位置,標(biāo)簽文本的格式p1.xaxis.set_major_locator(xmajorLocator)legend=p1.legend(handles=[A,B],labels=['圖1','圖2'])
結(jié)果如下所示:
5、設(shè)置邊界,不設(shè)置邊界經(jīng)常會(huì)因?yàn)闄M縱軸的字體太大等其他原因?qū)е聶M縱軸或者標(biāo)題只能顯示其中一部分。
plt.tight_layout(pad=4, w_pad=4.0, h_pad=3.0)
以上為個(gè)人經(jīng)驗(yàn),希望能給大家一個(gè)參考,也希望大家多多支持好吧啦網(wǎng)。
相關(guān)文章:
1. XML入門(mén)的常見(jiàn)問(wèn)題(三)2. .NET Core 分布式任務(wù)調(diào)度ScheduleMaster詳解3. 不要在HTML中濫用div4. HTML5實(shí)戰(zhàn)與剖析之觸摸事件(touchstart、touchmove和touchend)5. CSS清除浮動(dòng)方法匯總6. HTTP協(xié)議常用的請(qǐng)求頭和響應(yīng)頭響應(yīng)詳解說(shuō)明(學(xué)習(xí))7. XML在語(yǔ)音合成中的應(yīng)用8. ASP將數(shù)字轉(zhuǎn)中文數(shù)字(大寫(xiě)金額)的函數(shù)9. XML 非法字符(轉(zhuǎn)義字符)10. jscript與vbscript 操作XML元素屬性的代碼

 網(wǎng)公網(wǎng)安備