VUE+elementui組件在table-cell單元格中繪制微型echarts圖
需求效果圖示例
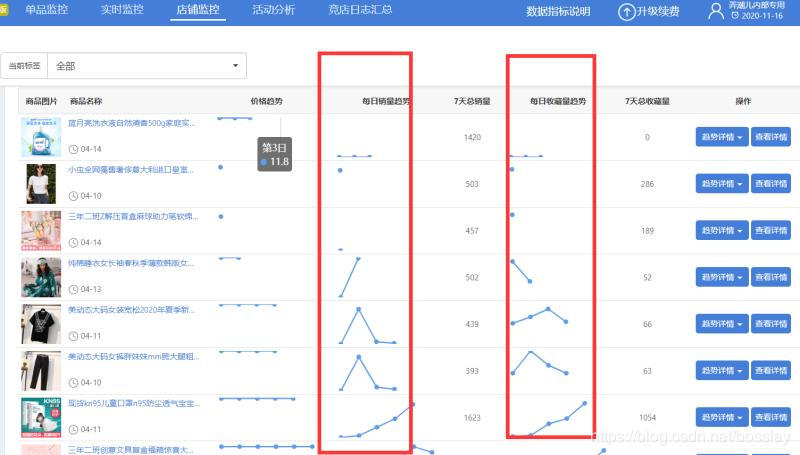
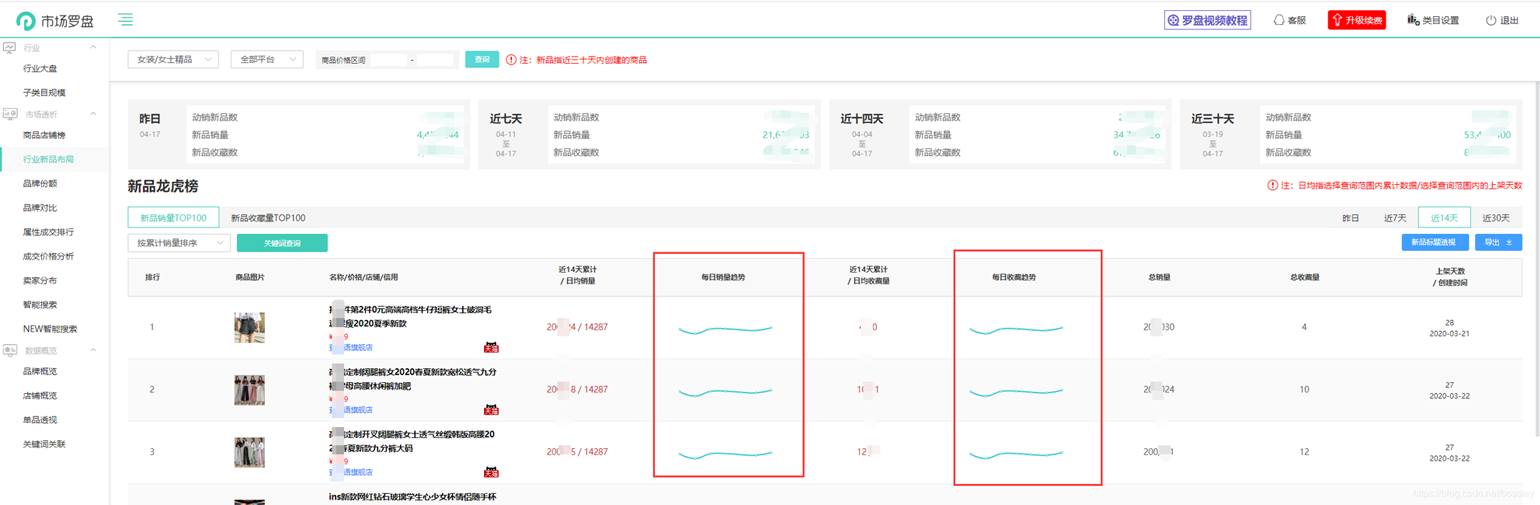
實際完成效果圖
 **
**
代碼實現
注:table表格為二次封裝的子組件-在table表格中 根據 scope.$index動態設置元素的id ,便于指定單元格的echarts初始化;
-在單元格中觸發一個方法,傳入當前的scope.row數據或者指定其他數據,并且傳入 scope.$index 以及一個字符串便于識別當前是哪條數據的charts
-在方法中繪制echarts**
<el-table-column align='center'> <template slot='header' slot-scope='scope'> <div v-if='tableTitle == ’sale’'> <p v-if='dateType != ’1’'>近{{ dateType }}天累計<br />/ 日均銷量 </p> <p v-if='dateType == ’1’'>昨日累計銷量</p> </div> <div v-if='tableTitle == ’fav’'> <p v-if='dateType != ’1’'>近{{ dateType }}天累計<br />/ 日均收藏量 </p> <p v-if='dateType == ’1’'>昨日累計收藏</p> </div> </template> <div slot-scope='scope' style='white-space:nowrap;'> <span class='xiao-red-color'>{{ realRowName(scope.row, ’0’) || ’-’ }}</span> <span v-if='dateType != ’1’' class='xiao-red-color'> / {{ isNaN(realRowName(scope.row, ’0’)) ? ’-’ : (realRowName(scope.row, ’0’) / (parseInt(dateType) - calcShelfTime(scope.row.real_created_time, ’0’) < 0 ? parseInt(dateType): calcShelfTime(scope.row.real_created_time, ’0’))).toFixed(0)}} </span> </div> </el-table-column> <el-table-column label='每日銷量趨勢' v-if='dateType != ’1’'> <template slot-scope='scope'> {{ drawEcharts(scope.row, scope.$index, ’sale’) }} <div : class='tiger-trend-charts'></div> </template> </el-table-column>
繪制echarts的方法(數據僅為示例,實際開發根據傳進來的scope.row數據)注意此處初始化echarts對象時采用VUE的this.$nextTick方法,以防獲取不到未渲染的節點元素。
drawEcharts() { //繪制趨勢echarts // console.log(arguments) let option = { tooltip: { trigger: ’axis’ }, // legend: { // data: [’每日30天銷量分析’] // }, grid: { left: ’10px’, right: ’30px’, top: ’40px’, bottom: ’10px’, containLabel: true }, xAxis: { show: false, type: ’category’, boundaryGap: false, data: [’03-21’, ’03-22’, ’03-23’, ’03-24’, ’03-25’, ’03-26’, ’03-27’] }, yAxis: { show: false, type: ’value’ }, series: [ { name: ’每日30天銷量分析’, type: ’line’, data: [120, 500, 101, 86, 173, 230, 6] } ] }; let chartId = ’tiger-’ + arguments[2] + ’-trend-index’ + arguments[1]; this.$nextTick(() => { let myChart = this.echarts.init(document.getElementById(chartId), ’macarons’); myChart.setOption(option); myChart.resize(); }); },
AND 不要忘記設置echarts的高度,否則一輩子也出不來圖形(示例,根據實施開發調整)
&-frame { display: flex; flex-flow: column nowrap; justify-content: space-between; .price-bar { color: red !important; } .tiger-trend-charts { height: 60px; min-width: 100px; } }
到此這篇關于VUE+elementui組件在table-cell單元格中繪制微型echarts圖的文章就介紹到這了,更多相關VUE elementui 單元格echarts圖內容請搜索好吧啦網以前的文章或繼續瀏覽下面的相關文章希望大家以后多多支持好吧啦網!
相關文章:
 網公網安備
網公網安備