Python flask框架如何顯示圖像到web頁面
代碼如下
webfig1.py
from flask import Flaskfrom flask import render_templateimport matplotlib.pyplot as pltimport ioimport base64app = Flask(__name__)@app.route(’/’)def build_plot(): img = io.BytesIO() y = [1,2,3,4,5] x = [0,2,1,3,4] plt.plot(x,y) plt.savefig(img, format=’png’) img.seek(0) plot_url = base64.b64encode(img.getvalue()).decode() return render_template(’plot.html’, plot_url=plot_url)if __name__ == ’__main__’: app.debug = True app.run()
plot.html
<!DOCTYPE html><html><title> Plot</title><body><img src='data:image/png;base64, {{ plot_url }}'></body></html>
先用py繪制了xy的圖像,然后經(jīng)過幾個(gè)命令,讓其轉(zhuǎn)化為plot_url,在傳給plot.html,就可以了

代碼在github:https://github.com/qingnvsue/flask中的webfig文件夾
我自己的程序是在網(wǎng)頁輸入sin函數(shù)的幅度,頻率,自變量范圍等,然后繪制這個(gè)sin函數(shù),讓其顯示到web頁面,如圖
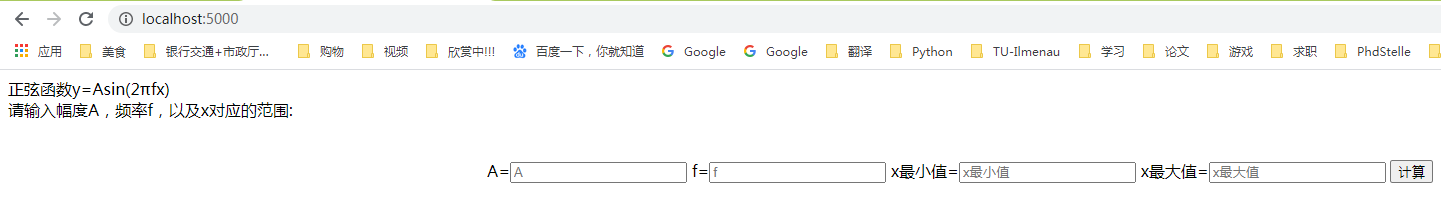
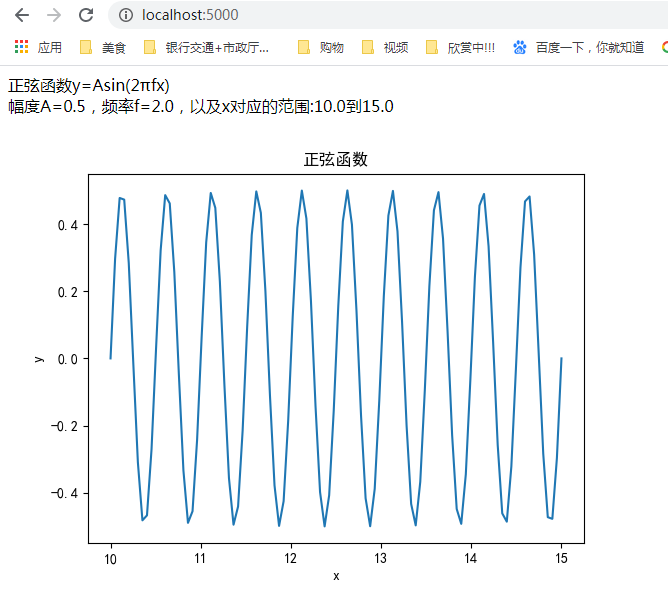
代碼在github:https://github.com/qingnvsue/flask中的sin文件夾
以上就是本文的全部內(nèi)容,希望對(duì)大家的學(xué)習(xí)有所幫助,也希望大家多多支持好吧啦網(wǎng)。
相關(guān)文章:
1. python中scrapy處理項(xiàng)目數(shù)據(jù)的實(shí)例分析2. 教你在 IntelliJ IDEA 中使用 VIM插件的詳細(xì)教程3. IntelliJ IDEA導(dǎo)入jar包的方法4. js抽獎(jiǎng)轉(zhuǎn)盤實(shí)現(xiàn)方法分析5. Python requests庫參數(shù)提交的注意事項(xiàng)總結(jié)6. vue-electron中修改表格內(nèi)容并修改樣式7. iOS實(shí)現(xiàn)點(diǎn)贊動(dòng)畫特效8. 通過Python pyecharts輸出保存圖片代碼實(shí)例9. JavaScript中l(wèi)ayim之整合右鍵菜單的示例代碼10. SpringBoot參數(shù)校驗(yàn)與國際化使用教程
 網(wǎng)公網(wǎng)安備